The debate between the investment potential of off-the-plan and resale properties has long stirred the interest of investors. In today’s analysis, we delve into the heart of Haymarket to uncover the truth behind the numbers. With a sample of 42 properties sold in 2023, originally purchased from developer Lendlease in 2017, we aim to shed light on how these off-the-plan purchases have fared in comparison to the broader market’s performance.
The Darling Square Phenomenon
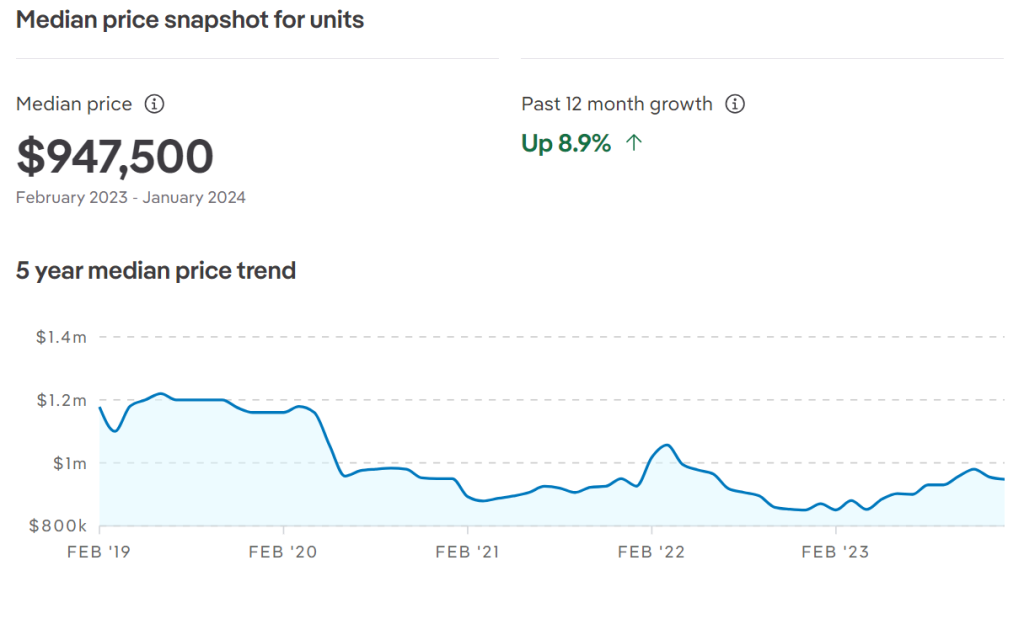
Before delving into our analysis, it’s essential to understand the backdrop against which these investments were made. According to data from realestate.com.au, Haymarket has experienced an impressive annual compound growth rate of 8.9% for units. This figure sets a high benchmark for our off-the-plan properties at Darling Square. But how do they stack up? Let’s dive into the numbers.
 Unpacking the Growth Rates
Our analysis revealed a diverse range of annual growth rates among the 43 properties, from a slight decline of -4.57% to a remarkable peak at 10.20%. Here’s a simplified breakdown:
- High Flyers: A notable segment of our properties outshone, with growth rates soaring above 5%. The standout performers even surpassed the 8.9% market average, highlighting the lucrative potential of well-chosen off-the-plan investments in Darling Square.
- Steady Movers: The bulk of our properties recorded moderate growth rates between 2% and 5%. These investments demonstrated stable appreciation, although not quite reaching the heights of Haymarket’s average.
- Slow Starters: A smaller portion of the properties showed growth rates below 2%, with one instance of depreciation. This category reminds us of the inherent risks and variability in property investments.
 Practical Insights
Our analysis suggests a nuanced picture. While off-the-plan properties in Darling Square have shown the potential for significant appreciation, the range of growth rates indicates that not all investments are created equal. The variability in performance underscores the importance of strategic selection and timing when investing in off-the-plan properties. Factors such as location within the complex, the reputation of the developer, and broader market conditions play critical roles in determining the outcome of such investments.
Conclusion: A Tale of Varied Fortunes
In comparing the growth rates of our sample to Haymarket’s average of 8.9%, it’s clear that while some off-the-plan properties can indeed outperform the broader market, others may lag behind. This variability highlights the need for thorough research and due diligence before making an investment decision. For those who choose wisely, the rewards can be substantial, but the path is not without its risks.
In summary, the story of Darling Square’s off-the-plan properties is one of varied fortunes. As the market continues to evolve, so too will the opportunities and challenges for investors in Haymarket and beyond. Whether you’re eyeing an off-the-plan purchase or considering other investment avenues, the key to success lies in informed decision-making and a keen eye for potential.
Looking Forward
Acknowledging this, our next exploration will delve into Chippendale’s famous Central Park, a locale with longer ownership periods. This comparison may offer insights into how extended holding impacts growth rates, providing a broader perspective on property investment dynamics.
AUTHOR
Joseph Fairchild
An award-winning agent with a vision of growth, Joseph Fairchild has over 25 years of experience within the Real Estate space. Since its inception in 2009, Joseph has grown Metro Realty from an idea to No.1 Agency in Sydney with multiple award-winning agents.
Annexure:
| Property Address | Sold price in 2023 | Initial purchase price | Annual Growth Rate |
| 2807/81 HARBOUR STREET HAYMARKET NSW 2000 |
2,570,000 | 1,835,000 | 6.97% |
| 2910/81 HARBOUR STREET HAYMARKET NSW 2000 |
910,000 | 1,150,000 | -4.57% |
| 3405/81 HARBOUR STREET HAYMARKET NSW 2000 |
1,808,000 | 1,570,000 | 2.86% |
| 3501/81 HARBOUR STREET HAYMARKET NSW 2000 |
1,438,000 | 1,290,000 | 2.20% |
| 604/83 HARBOUR STREET HAYMARKET NSW 2000 |
1,200,000 | 972,500 | 4.29% |
| 704/83 HARBOUR STREET HAYMARKET NSW 2000 |
1,350,000 | 982,000 | 6.57% |
| 908/83 HARBOUR STREET HAYMARKET NSW 2000 |
908,000 | 841,000 | 1.54% |
| 1305/83 HARBOUR STREET HAYMARKET NSW 2000 |
1,580,000 | 1,259,500 | 4.64% |
| 1401/83 HARBOUR STREET HAYMARKET NSW 2000 |
970,000 | 779,000 | 4.48% |
| 1808/83 HARBOUR STREET HAYMARKET NSW 2000 |
1,290,000 | 984,000 | 5.56% |
| 1004/82 HAY STREET HAYMARKET NSW 2000 | 1,288,000 | 1,065,000 | 3.88% |
| 1201/82 HAY STREET HAYMARKET NSW 2000 | 920,000 | 850,000 | 1.60% |
| 1211/82 HAY STREET HAYMARKET NSW 2000 | 925,000 | 850,000 | 1.71% |
| 1603/82 HAY STREET HAYMARKET NSW 2000 | 1,735,000 | 1,550,000 | 2.28% |
| 1707/82 HAY STREET HAYMARKET NSW 2000 | 2,220,000 | 1,900,000 | 3.16% |
| 1804/82 HAY STREET HAYMARKET NSW 2000 | 1,290,000 | 1,105,000 | 3.14% |
| 1904/82 HAY STREET HAYMARKET NSW 2000 | 1,330,000 | 1,175,000 | 2.51% |
| 2102/82 HAY STREET HAYMARKET NSW 2000 | 1,350,000 | 1,285,000 | 0.99% |
| 2805/82 HAY STREET HAYMARKET NSW 2000 | 2,400,000 | 2,200,000 | 1.76% |
| 2809/82 HAY STREET HAYMARKET NSW 2000 | 850,000 | 825,000 | 0.60% |
| 106/10 NICOLLE WALK HAYMARKET NSW 2000 | 852,000 | 817,000 | 0.84% |
| 1011/1 STEAM MILL LANE HAYMARKET NSW 2000 |
660,000 | 525,000 | 4.68% |
| 1071/1 STEAM MILL LANE HAYMARKET NSW 2000 |
837,000 | 623,000 | 6.08% |
| 1111/1 STEAM MILL LANE HAYMARKET NSW 2000 |
840,000 | 635,000 | 5.76% |
| 1152/1 STEAM MILL LANE HAYMARKET NSW 2000 |
1,745,000 | 1,190,000 | 7.96% |
| 1204/1 STEAM MILL LANE HAYMARKET NSW 2000 |
1,050,000 | 790,000 | 5.86% |
| 1225/1 STEAM MILL LANE HAYMARKET NSW 2000 |
1,950,000 | 1,200,000 | 10.20% |
| 3291/65 TUMBALONG BOULEVARD HAYMARKET NSW 2000 |
830,000 | 731,500 | 2.56% |
| 3293/65 TUMBALONG BOULEVARD HAYMARKET NSW 2000 |
2,200,000 | 1,555,000 | 7.19% |
| 3299/65 TUMBALONG BOULEVARD HAYMARKET NSW 2000 |
1,050,000 | 909,000 | 2.93% |
| 3302/65 TUMBALONG BOULEVARD HAYMARKET NSW 2000 |
1,050,000 | 922,000 | 2.63% |
| 3331/65 TUMBALONG BOULEVARD HAYMARKET NSW 2000 |
870,000 | 731,500 | 3.53% |
| 3353/65 TUMBALONG BOULEVARD HAYMARKET NSW 2000 |
2,200,000 | 1,645,000 | 5.99% |
| 3357/65 TUMBALONG BOULEVARD HAYMARKET NSW 2000 |
2,700,000 | 1,735,000 | 9.25% |
| 3365/65 TUMBALONG BOULEVARD HAYMARKET NSW 2000 |
1,590,000 | 1,140,000 | 6.88% |
| 3369/65 TUMBALONG BOULEVARD HAYMARKET NSW 2000 |
985,000 | 927,000 | 1.22% |
| 601/70 TUMBALONG BOULEVARD HAYMARKET NSW 2000 |
2,660,000 | 1,905,000 | 6.90% |
| 3195/65 TUMBALONG BOULEVARD HAYMARKET NSW 2000 |
1,112,000 | 985,000 | 2.46% |
| 3171/65 TUMBALONG BOULEVARD HAYMARKET NSW 2000 |
795,000 | 768,000 | 0.69% |